array_list = [np.random.rand(85, 1700) for _ inrange(10)] # Replace with your actual arrayspercentiles = [10, 50, 90]estimator = OnlinePercentileEstimator(percentiles)for array in array_list: estimator.update(array)results = estimator.calculate_percentiles()print(results)
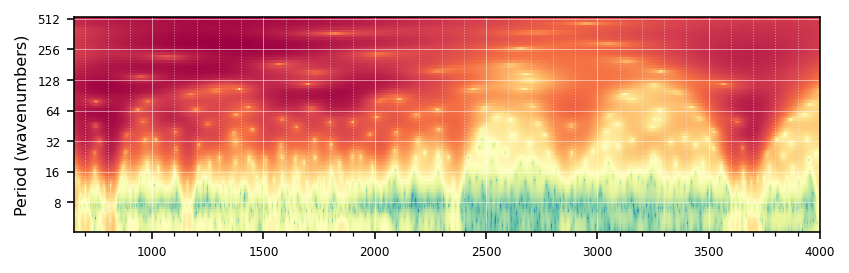
Estimate the percentiles of the power of the wavelet transform of the spectra.
Exported source
# Outdatedclass OnlinePercentileEstimator:"Estimate the percentiles of the power of the wavelet transform of the spectra."def__init__(self, percentiles, n_samples=1000):self.percentiles = percentilesself.n_samples = n_samplesself.values = np.empty((n_samples, len(percentiles)))self.current_index =0self.is_full =Falsedef update(self, array): array_flat = array.flatten() percentiles_values = np.percentile(array_flat, self.percentiles) n =len(percentiles_values)ifself.current_index +1>self.n_samples:self.is_full =Trueself.current_index =0# Overwrite from the beginning if buffer is fullself.values[self.current_index, :] = percentiles_valuesself.current_index +=1def calculate_percentiles(self):ifself.is_full: combined_values =self.valueselse: combined_values =self.values[:self.current_index, :]return np.percentile(combined_values.flatten(), self.percentiles, axis=0)
Estimate the percentiles of the power of the wavelet transform of the spectra.
Exported source
# Outdateddef estimate_percentiles(X_trans, n_samples=100, percentiles=[10, 20, 30, 40, 50, 60, 70, 80, 90, 95, 99]):"Estimate the percentiles of the power of the wavelet transform of the spectra." random_indices = np.random.choice(X_trans.shape[0], n_samples, replace=False) estimator = OnlinePercentileEstimator(percentiles)for i in tqdm(random_indices): estimator.update(CWT(X_trans[i, :])().power)return estimator.calculate_percentiles()
Create a CSV file with the image names and the target values.
Type
Default
Details
data
SpectralData
Spectra dataclass
n_samples
int
None
number of samples to process
output_dir
str
../_data/ossl-tfm/
path to save the CSV file
fname
str
im-targets-lut.csv
Returns
None
Exported source
def create_image_target_csv(data: SpectralData, # Spectra dataclass n_samples: int=None, # number of samples to process output_dir: str='../_data/ossl-tfm/', # path to save the CSV file fname: str='im-targets-lut.csv' ) ->None: "Create a CSV file with the image names and the target values." n_samples =len(data.sample_indices) if n_samples isNoneelse n_samples items = {'fname': [f'{id}.png'foridin data.sample_indices[:n_samples]], }for i, y_name inenumerate(data.y_names): items[y_name] = [data.y[j, i].item() for j inrange(n_samples)] df = pd.DataFrame(items) df.to_csv(Path(output_dir) / fname, index=False)
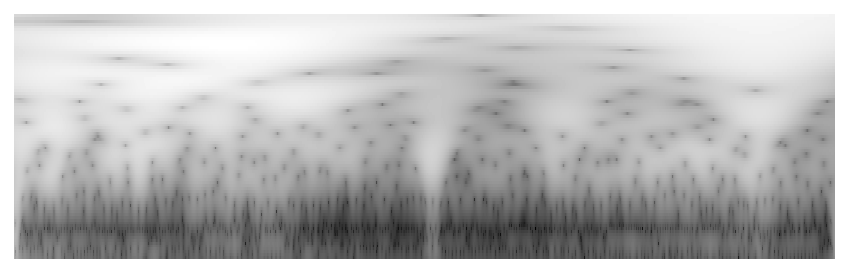
Process a single sample and save the wavelet image to the output directory.
Exported source
def process_single_sample(args):"Process a single sample and save the wavelet image to the output directory." i, id, X_trans_i, wavenumbers, output_dir, cwt_kwargs, plot_kwargs = args fname_img =f'{output_dir}/{id}.png' cwt_result = CWT(X_trans_i, **cwt_kwargs)() plot_cwt(cwt_result, wavenumbers=wavenumbers, save_path=fname_img, show_plot=False, **plot_kwargs)