import pandas as pd
from pathlib import Path

from sklearn.metrics import r2_score
from uhina.loading import LoaderFactory, plot_spectra
from uhina.preprocessing import TakeDerivative, SNV
from sklearn.pipeline import Pipeline
from sklearn.decomposition import PCA, KernelPCA
from sklearn.preprocessing import StandardScaler

import warnings
warnings.filterwarnings('ignore')

pd.set_option('display.max_rows', 100)

import plotly
import plotly.express as px
import numpy as np
from astartes import train_val_test_splitOSSL vs Ringtrial
Explorative Data Analysis of OSSL vs Ringtrial
Loading data
src = Path.home() / 'pro/data/woodwell-ringtrial/drive-download-20231013T123706Z-001'
loader = LoaderFactory.get_loader(src, 'ringtrial')
data_rt = loader.load_data(analytes='potassium_cmolkg')
data_rt.ds = np.array([s.split('-rt')[0] for s in data_rt.sample_indices])
print(f'X shape: {data_rt.X.shape}')

plot_spectra(data_rt, n_spectra=100, snv=True, alpha=0.2, figsize=(12, 3));
X shape: (1400, 1676)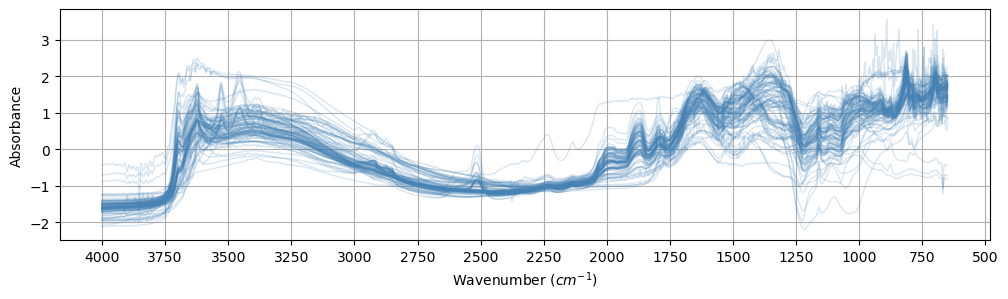
src = Path.home() / '.lssm/data/ossl/ossl_all_L0_v1.2.csv.gz'
loader = LoaderFactory.get_loader(src, 'ossl', spectra_type='mir')
data_ossl = loader.load_data(analytes='k.ext_usda.a725_cmolc.kg')
print(f'X shape: {data_ossl.X.shape}')
Loading data from /Users/franckalbinet/.lssm/data/ossl/ossl_all_L0_v1.2.csv.gz ...
X shape: (57674, 1676)plot_spectra(data_ossl, n_spectra=100, snv=True, alpha=0.2, figsize=(12, 3))(<Figure size 1200x300 with 1 Axes>,
<Axes: xlabel='Wavenumber ($cm^{-1}$)', ylabel='Absorbance'>)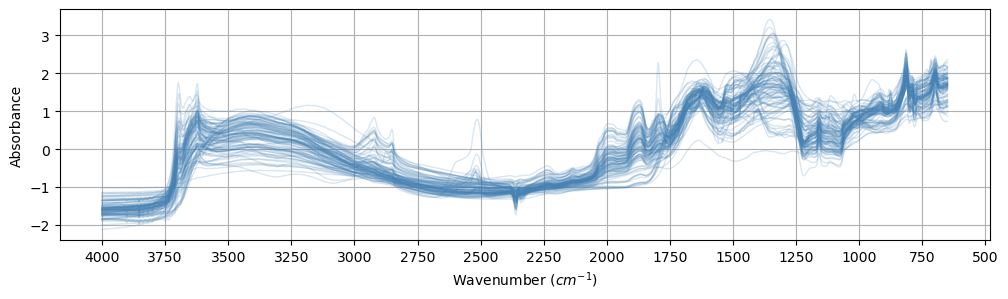
def pca_rt_ossl(data_rt, data_ossl):
    # Combine the spectra from both datasets
    X_combined = np.vstack((data_rt.X, data_ossl.X))

    # Create the pipeline
    pipe = Pipeline([
        ('SNV', SNV()),
        ('Derivative', TakeDerivative()),
        ('Scaler', StandardScaler()),
        ('PCA', PCA(n_components=3))
    ])

    # Fit and transform the combined data
    X_pca_combined = pipe.fit_transform(X_combined)

    # Split the results back into rt and ossl
    data_rt.X_pca = X_pca_combined[:data_rt.X.shape[0]]
    data_ossl.X_pca = X_pca_combined[data_rt.X.shape[0]:]

    return data_rt, data_ossl
data_rt, data_ossl = pca_rt_ossl(data_rt, data_ossl)from matplotlib import pyplot as plt
plt.scatter(data_ossl.X_pca[:, 0], data_ossl.X_pca[:, 1], s=5, alpha=0.1)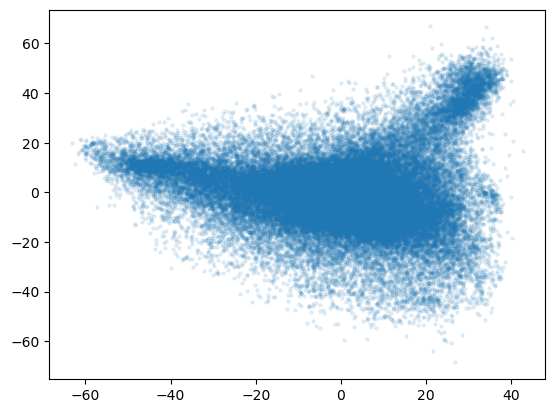
n_samples = 100
idx = np.random.choice(data_ossl.X_pca.shape[0],
                       size=n_samples, replace=False)

X_ossl_subset = data_ossl.X_pca[idx]
lut_ossl_ds = {i: ds for i, ds in enumerate(data_ossl.dataset_labels)}data_ossl.dataset_namesarray([0, 0, 0, ..., 3, 3, 3])np.vectorize(lut_ossl_ds.get)(data_ossl.dataset_names)array(['GARRETT.SSL', 'GARRETT.SSL', 'GARRETT.SSL', ...,
'LUCAS.WOODWELL.SSL', 'LUCAS.WOODWELL.SSL', 'LUCAS.WOODWELL.SSL'],
dtype='<U18')data_rt.X_pcaarray([[-37.57209416, 10.0194439 , 1.41901894],
[ 24.05922823, 10.83135662, 12.43538485],
[ 8.09090194, -26.63507173, 7.36763935],
...,
[ 8.44862862, -4.47373073, 2.51161567],
[ 15.9657049 , 8.60238863, -19.86332133],
[ 2.45832757, 6.53856188, 3.22457499]])mask_rt_ds = data_rt.ds == 'kssl'data_ossl.X_pcaarray([[ 2.45822505, 16.4823169 , 9.00422903],
[ -2.36297831, 10.87565108, 7.6014877 ],
[ -4.66533181, 11.81300838, 7.77196598],
...,
[ 33.2311886 , -6.53547903, 8.0031913 ],
[ 8.18561655, 24.05135848, 14.03594385],
[-11.41377595, 8.67332126, -6.78131327]])def data_to_df(data_ossl, data_rt,
n_samples_ossl=100, rt_ds='kssl',
cols=['PC1', 'PC2', 'PC3']):
lut_ossl_ds = {i: ds for i, ds in enumerate(data_ossl.dataset_labels)}
idx = np.random.choice(data_ossl.X_pca.shape[0], size=n_samples_ossl, replace=False)
X_ossl_subset = data_ossl.X_pca[idx,:]
ds_ossl = np.vectorize(lut_ossl_ds.get)(data_ossl.dataset_names[idx])
df_ossl = pd.DataFrame(X_ossl_subset, columns=cols)
df_ossl['ds'] = ds_ossl
# return df_ossl
mask = data_rt.ds == rt_ds
X_rt = data_rt.X_pca[mask]
df_rt = pd.DataFrame(X_rt, columns=cols)
df_rt['ds'] = rt_ds + '-rt'
# df_rt = pd.DataFrame(np.c_[X_rt, np.full(np.sum(mask), rt_ds + '-rt')], columns=cols)
return pd.concat([df_ossl, df_rt], axis=0, ignore_index=True)df = data_to_df(data_ossl, data_rt, n_samples_ossl=200)def plot_scatter3d(df, size_dict=None, default_opacity=0.7):
"""
Generates a nicely formatted 3D scatter plot of the data with different symbols, colors, and sizes for each dataset.
Args:
df (pd.DataFrame): DataFrame containing the data with columns 'PC1', 'PC2', 'PC3', 'ds'
size_dict (dict, optional): Dictionary mapping dataset names to dot sizes. Defaults to None.
default_opacity (float, optional): Default opacity for all points. Defaults to 0.7.
"""
# Default size
default_size = 20
# If size_dict is not provided, initialize it with default values
if size_dict is None:
size_dict = {}
# Create dot_size column based on the ds column, using defaults if not in dict
df['dot_size'] = df['ds'].map(lambda x: size_dict.get(x, default_size))
fig = px.scatter_3d(
df,
x='PC1',
y='PC2',
z='PC3',
color='ds',
symbol='ds',
size='dot_size',
opacity=default_opacity,
hover_data=['ds'],
color_discrete_sequence=px.colors.qualitative.Set1,
)
fig.update_traces(marker=dict(line=dict(width=0)))
fig.update_layout(
scene=dict(
xaxis_title='PC1',
yaxis_title='PC2',
zaxis_title='PC3'
),
legend_title='Dataset',
height=800,
width=1000,
)
fig.show()data_ossl.dataset_labelsarray(['GARRETT.SSL', 'ICRAF.ISRIC', 'KSSL.SSL', 'LUCAS.WOODWELL.SSL'],
dtype=object)np.unique(data_rt.ds)array(['agrocares', 'argonne', 'csu-il', 'eth-alpha-1', 'eth-alpha-2',
'eth-vertex', 'iaea-aug2022', 'kssl', 'landcare', 'lesotho', 'msu',
'osu', 'rothamsted', 'scion', 'ughent', 'uiuc', 'usp',
'uwisc-fine', 'woodwell-alpha', 'woodwell-vertex'], dtype='<U15')size_dict = {
'KSSL.SSL': 1,
'GARRETT.SSL': 3,
'ICRAF.ISRIC': 3,
'LUCAS.WOODWELL.SSL': 3,
}
plot_scatter3d(
data_to_df(data_ossl, data_rt, n_samples_ossl=5000, rt_ds='iaea-aug2022'),
size_dict=size_dict)Unable to display output for mime type(s): application/vnd.plotly.v1+json