Variable
def Variable(
    name:str, value:float
)->None:
A named value that describes one area.
A State describes every area by a set of variables computed from the measurements collected so far. Each callback computes one variable, such as the highest value (MaxCB) or the number of measurements (CountCB). Calling a State runs every callback on every area and returns one row per loc_id. Optimizer ranks the areas from this table.
def Callback(
    *args, **kwargs
):
Base class for state callbacks. __call__(loc_id, o) returns a Variable, or a tuple of them, for area loc_id of State o.
def State(
    measurements:geopandas.geodataframe.GeoDataFrame, # Measurements so far: a `value` column and `Point` geometries, indexed by `loc_id`
    smp_areas:geopandas.geodataframe.GeoDataFrame, # Areas to describe, indexed by `loc_id`, such as the output of `gridder`
    cbs:List[collections.abc.Callable], # Callbacks that compute the state variables
):
State variables of each area, computed by callbacks from the measurements collected so far.
def get(
    loc_id:str, # Area to describe
    as_numpy:bool=False, # Return `(names, values)` arrays instead of a list of `Variable`s?
):
State variables of area loc_id.
def __call__(
    loc_id:NoneType=None, # Ignored: every area is computed
    **kwargs
)->pandas.DataFrame: # One row per `loc_id` and one column per variable
State variables of every area in smp_areas.
def expand_to_k_nearest(
    subset_measurements:geopandas.geodataframe.GeoDataFrame, # Measurements to expand, usually those of one area
    k:int=5, # Number of nearest measurements to take for each point, counting the point itself
)->geopandas.geodataframe.GeoDataFrame: # `k` rows for each point of `subset_measurements`, duplicates included, with a default index
The k measurements nearest to each point of subset_measurements, from any area.
Each callback below computes one variable per area. MaxCB, MinCB, StdCB, CountCB and MoranICB return NaN for an area without measurements. A missing count is therefore NaN, not 0. Optimizer.get_rank treats a missing value as the highest priority for its criterion.
To add a variable, subclass Callback and implement __call__(loc_id, o). Return a tuple of Variables to add several columns at once.
def MaxCB(
    name:str='Max', # Name of the variable
):
Highest measured value in the area. NaN if the area has no measurements.
def MinCB(
    name:str='Min', # Name of the variable
):
Lowest measured value in the area. NaN if the area has no measurements.
def StdCB(
    name:str='Standard Deviation', # Name of the variable
):
Standard deviation of the measured values in the area. NaN if the area has no measurements.
def CountCB(
    name:str='Count', # Name of the variable
):
Number of measurements in the area. NaN if the area has no measurements.
def MoranICB(
    k:int=5, # Number of neighbours per point, used to expand the measurements and to build the spatial weights
    p_threshold:float=0.05, # Significance level: Moran's I is `NaN` when its pseudo p-value `p_sim` is at or above it
    name:str='Moran.I', # Name of the variable
    min_n:int=5, # Areas with `min_n` measurements or fewer get `NaN`
):
Moran’s I of the area’s measurements and their nearest neighbours. NaN if the area has too few measurements or Moran’s I is not significant.
def PriorCB(
    fname_raster:str, # Raster used as the prior
    name:str='Prior', # Name of the variable
):
Mean of fname_raster over the area, emulating prior knowledge such as an airborne survey. Computed for every area, measured or not.
The example emulates one campaign on a 10 by 10 grid. Each area gets between 0 and 9 points:
fname_raster = 'files/ground-truth-01-4326-simulated.tif'
gdf_grid = gridder(fname_raster, nrows=10, ncols=10)
n = np.random.default_rng(41).integers(0, 10, size=len(gdf_grid))
samples_t0 = DataCollector(fname_raster).collect(Sampler(gdf_grid).sample(n, method='uniform', rng=41))
ax = samples_t0.plot(column='value', s=3, legend=True)
gdf_grid.boundary.plot(color=black, lw=0.5, ax=ax)
ax.axis('off');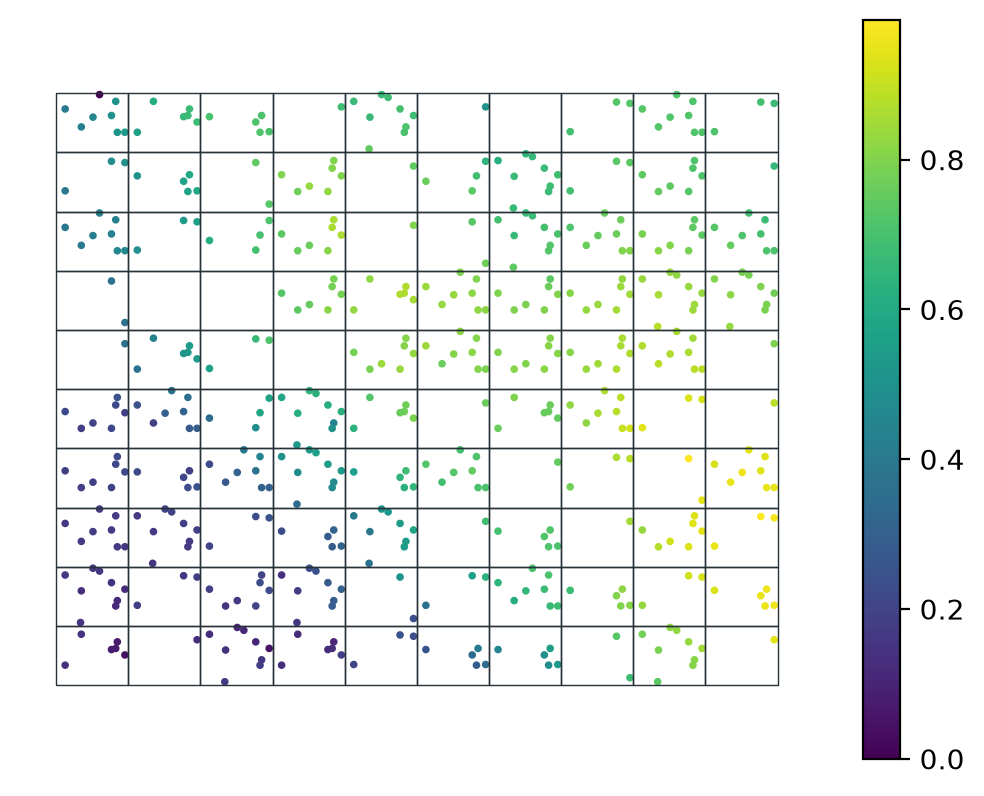
Create a State with the callbacks to compute, then call it to get one row per area. MoranICB tests significance with random permutations. Fixing NumPy’s global seed makes its results reproducible:
np.random.seed(0)
state = State(samples_t0, gdf_grid, cbs=[
    MaxCB(), MinCB(), StdCB(), CountCB(), MoranICB(k=5), PriorCB(fname_raster)
])
state_t0 = state()
test_eq(len(state_t0), len(gdf_grid))
state_t0.head()| Max | Min | Standard Deviation | Count | Moran.I | Prior | |
|---|---|---|---|---|---|---|
| loc_id | ||||||
| 0 | 0.142204 | 0.043098 | 0.038206 | 6.0 | 0.874200 | 0.108520 |
| 1 | 0.160292 | 0.111590 | 0.017177 | 9.0 | 0.623260 | 0.133123 |
| 2 | 0.177072 | 0.156276 | 0.007273 | 8.0 | 0.579608 | 0.161802 |
| 3 | 0.227234 | 0.181968 | 0.016882 | 7.0 | 0.788752 | 0.195281 |
| 4 | 0.257189 | 0.177842 | 0.023974 | 7.0 | 0.505154 | 0.213253 |
Areas without measurements have NaN for every variable except Prior:
unsampled = state_t0.loc[state.unsampled_locs]
test_eq(unsampled.drop(columns='Prior').isna().all().all(), True)
unsampled.head()| Max | Min | Standard Deviation | Count | Moran.I | Prior | |
|---|---|---|---|---|---|---|
| loc_id | ||||||
| 16 | NaN | NaN | NaN | NaN | NaN | 0.499298 |
| 26 | NaN | NaN | NaN | NaN | NaN | 0.677758 |
| 35 | NaN | NaN | NaN | NaN | NaN | 0.705157 |
| 69 | NaN | NaN | NaN | NaN | NaN | 0.596509 |
get computes the variables of one area:
state.get(state_t0['Count'].idxmax())[Variable(name='Max', value=np.float32(0.16029228)),
Variable(name='Min', value=np.float32(0.11158965)),
Variable(name='Standard Deviation', value=np.float32(0.017177373)),
Variable(name='Count', value=9),
Variable(name='Moran.I', value=np.float64(0.6232596338489773)),
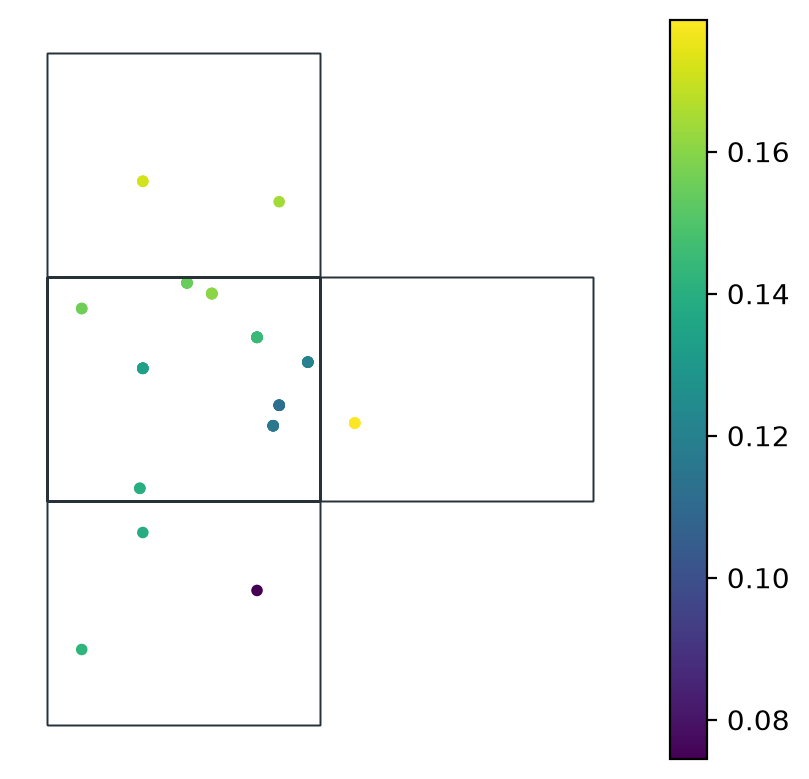
Variable(name='Prior', value=np.float64(0.13312284457997908))]Moran’s I measures spatial autocorrelation. It is close to 1 when nearby measurements have similar values, and close to 0 when values are spatially random. One area rarely has enough measurements to estimate it alone. MoranICB therefore adds the k nearest measurements of each point in the area, including those in neighbouring areas. expand_to_k_nearest does this expansion.
The plot shows the expanded measurements of the area with the most measurements, and the areas they come from:
loc_id = state_t0['Count'].idxmax()
subset = state.measurements.loc[[loc_id]]
expanded_pts = state.expand_to_k_nearest(subset, k=5)
test_eq(len(expanded_pts), 5 * len(subset))
ax = expanded_pts.plot(column='value', s=10, legend=True)
gpd.sjoin(gdf_grid, expanded_pts, how="inner", predicate='contains').boundary.plot(color=black, lw=0.5, ax=ax)
ax.axis('off');